


 |
Minimized hardware costs with persistent memory |


5
10
15
16
22
27
34
37
38
42
46
48
50
53
55%Improved employee productivity |
10
14
19
24
27
31
33
36
38
39
42
43
47
49
50%Improved capacity for innovation |
10
14
19
22
23
25
28
29
32
36
38
40
42
44
45%Reduced technology infrastructure costs |
10
14
19
22
23
25
28
29
32
36
38
42
44
46
47%Improved analytic efficiency |


 |
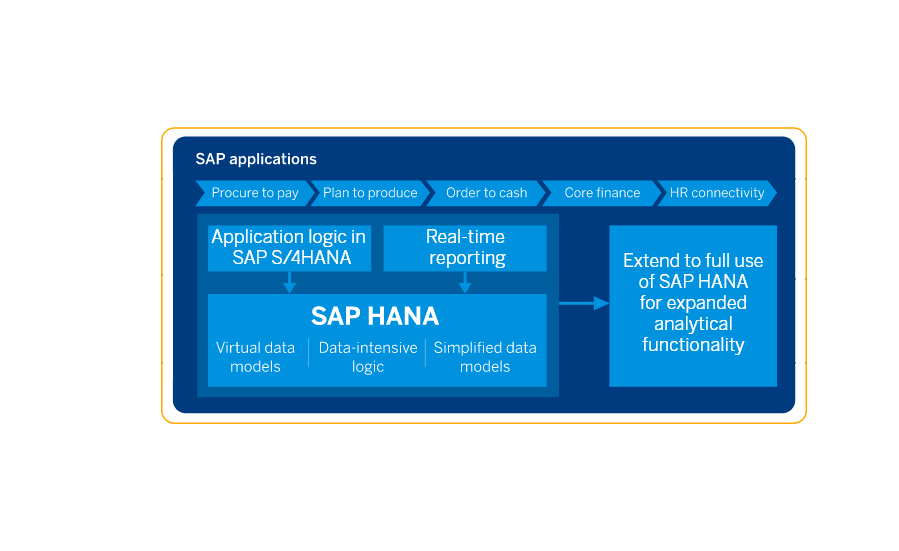
Process transactions and analytics simultaneously within the same applications (see figure on this page) |
 |
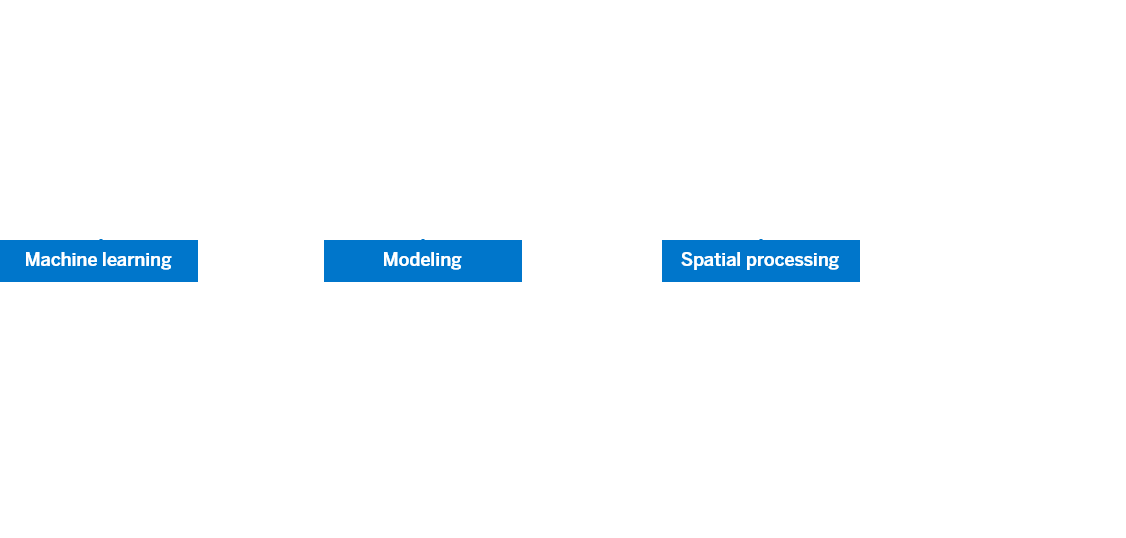
Combine advanced analytics techniques to extract contextual insights |

 |
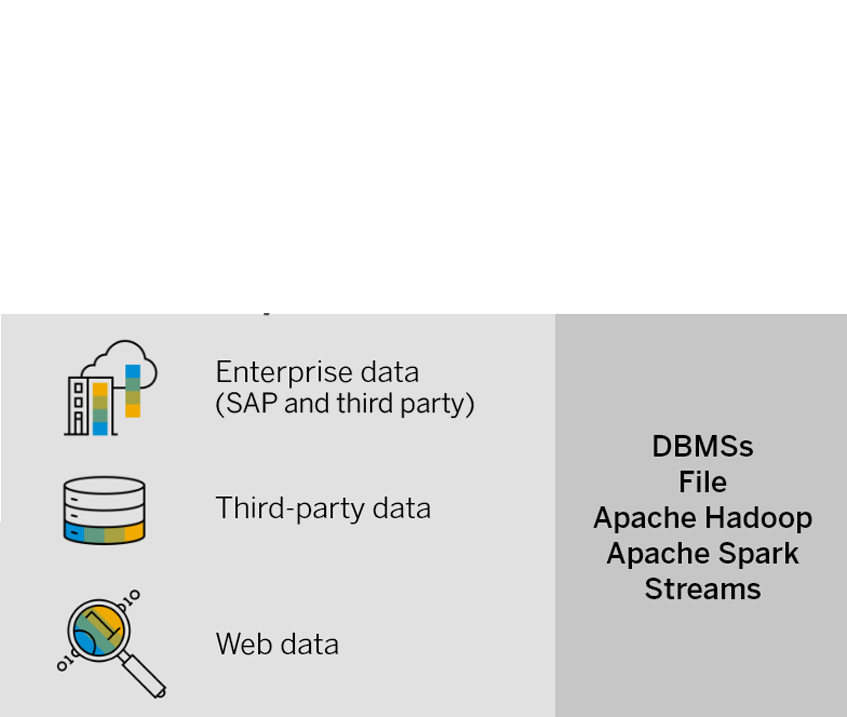
Deliver a unified view through a single logical data model, helping you access all data |


 |
Open interfaces and tools |
 |
Develop once, deploy everywhere |
 |
Free for application development |
 |
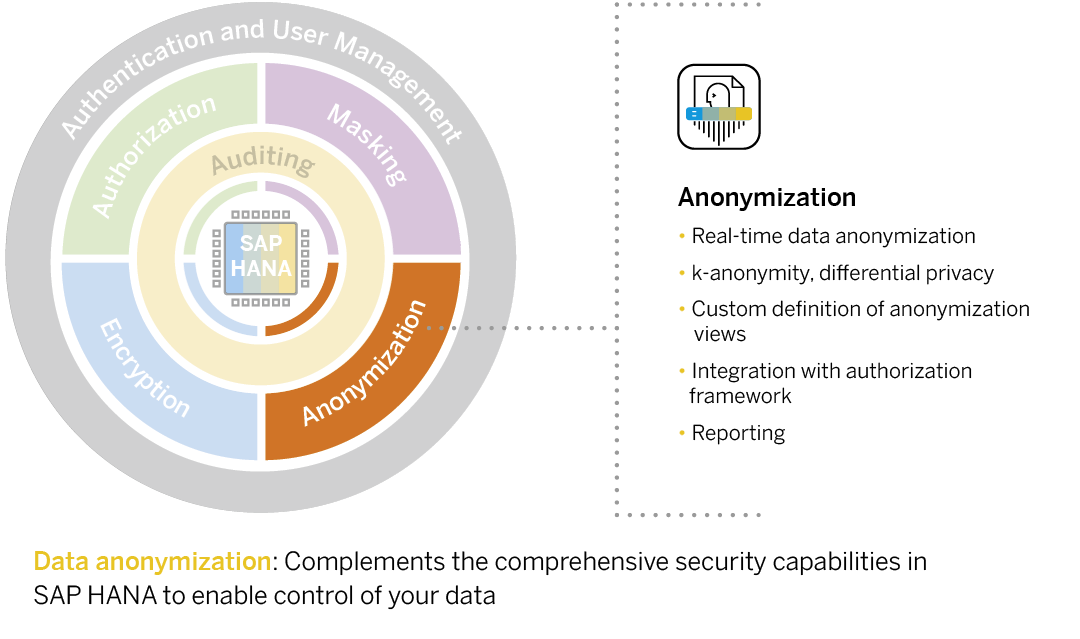
Data security and advanced privacy protection with real-time anonymization |
 |
Ubiquitous data access and governance |
 |
Trusted expertise and best practices |
 |
Tools for developers and business users |
 |
Modern architecture to embrace new technology innovations |


Technology partner ecosystem
Support for persistent memory
|

Early technology adoption
Blockchain integration |


 |
App server | |
Multilanguage and bring your own license |
 |
Application lifecycle management |

 |
Predictive and business libraries |

 |
UI5 and SAP Fiori user experience |

 |
Graphic modeler |
|
On premise, hybrid, and multi-cloud |  |


 Innovate without
  Adapt with agility –
  Simplify for efficiency –
  Augment transactional
applications with advanced analytics such as machine learning and predictive modeling.
Augment transactional
applications with advanced analytics such as machine learning and predictive modeling.
 Renovate IT landscapes without disrupting consumer information by virtualizing data access.
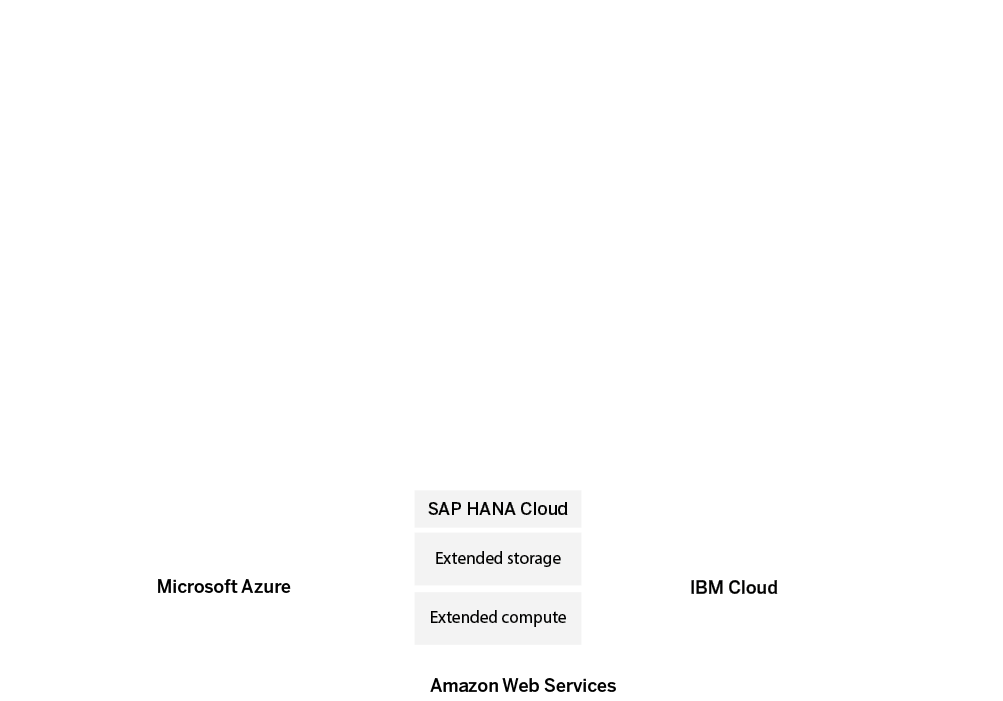
 Choose preferred
infrastructure with a
managed database on
any cloud (multi-cloud).
Choose preferred
infrastructure with a
managed database on
any cloud (multi-cloud).
 Store and perform
complex processing of
multiple data types
(for example, relational, spatial, graph, and JSON documents).
Store and perform
complex processing of
multiple data types
(for example, relational, spatial, graph, and JSON documents).
 Transform data on the fly to quickly adapt to business needs with virtual data models.
Optimize performance
and cost using advanced
in-memory management and data tiering with elastic scalability.
Transform data on the fly to quickly adapt to business needs with virtual data models.
Optimize performance
and cost using advanced
in-memory management and data tiering with elastic scalability.
 Innovate with modern
applications that combine transactional and analytical workloads on a single data set.
Innovate with modern
applications that combine transactional and analytical workloads on a single data set.
 Extend your data footprint and workloads across on-premise and cloud landscapes.
 Preserve privacy and trust while deriving value from data with real-time data
anonymization and security.
Preserve privacy and trust while deriving value from data with real-time data
anonymization and security.
 Develop intelligent,
real-time solutions that meet business needs.
Equip IT to quickly adapt
to business needs without disruption.
Simplify IT landscapes and reduce data management burden to lower TCO.
Develop intelligent,
real-time solutions that meet business needs.
Equip IT to quickly adapt
to business needs without disruption.
Simplify IT landscapes and reduce data management burden to lower TCO.


 |
Real-time insight to action with embedded analytics enabled by high-performance, in-memory processing |


|
Faster, more intelligent business processes augmented with automation and intelligence |
 |
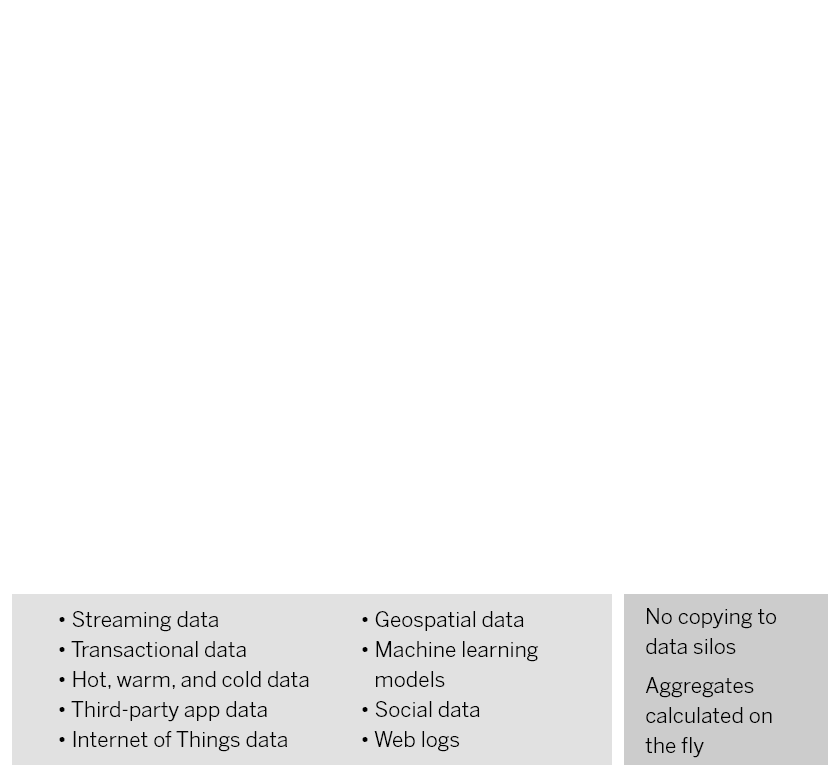
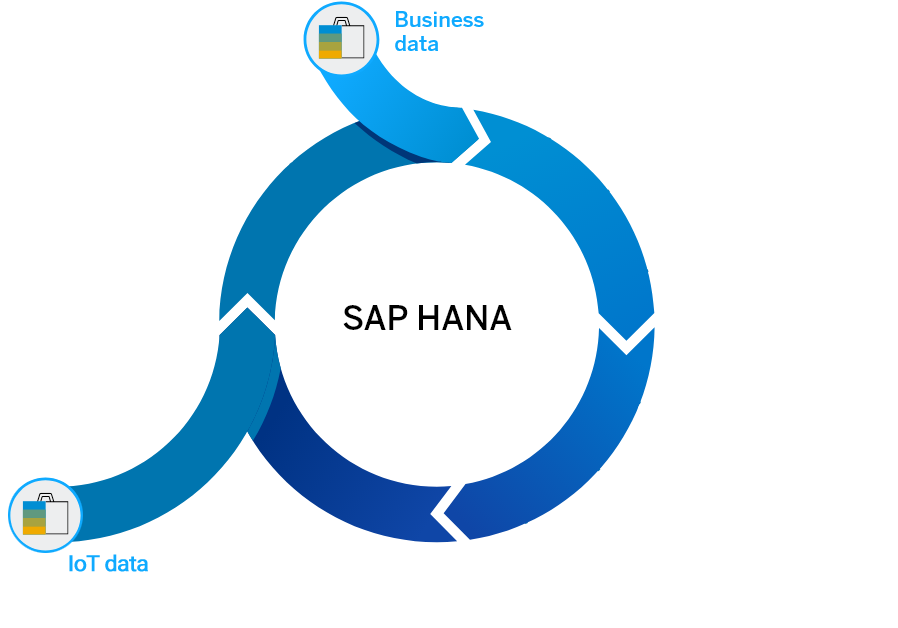
Increased situational awareness by enriching business data with IoT, spatial, and other forms of data and analyzing it in context |
 |
Improved business productivity with simpler applications |
|
Reduced IT system landscape complexity by supporting both operational and analytical workloads on a single system |
|
Significantly decreased data storage needs, lowering total cost of ownership |
 |
Increased business agilityto respond to market forces and pivot business processes |
 |
Improved customer experiencesthrough personalized interactions and self-service tools |
|
|
Higher business performanceusing intelligent technologies and data assets to meet business goals faster and with less risk |


|
Real-time insight and predictions on live transactions and historical data |
  |
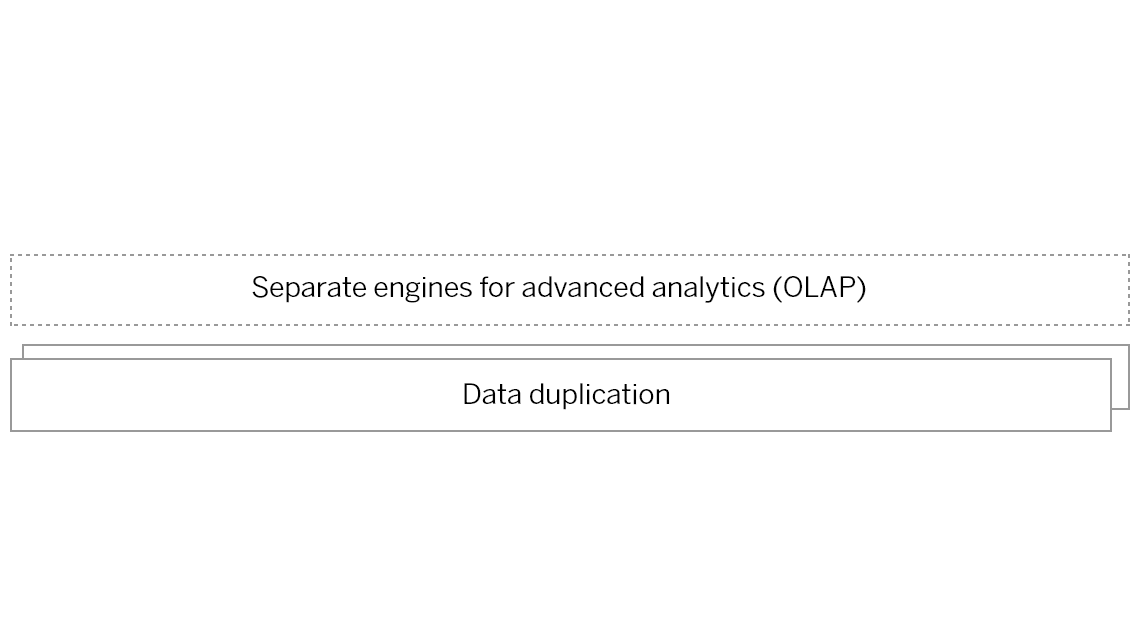
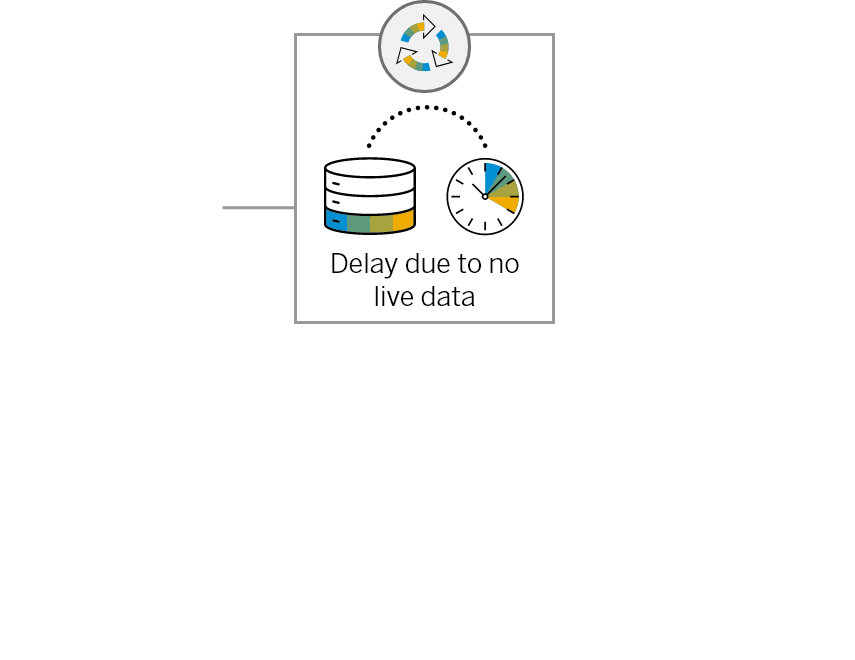
Simplified IT landscape – with one platform and less data duplication |
 |
Faster time to value, thanks to a simplified application architecture |
|
Lower total cost of ownership |

  |
Increased flexibility, supporting deployment on premise or fully managed on any cloud |
 |
Newly unleashed power of data without breaching trust |
 |
Enhanced abilityto address stadium issues in real time while seizing opportunities to improve the game-day experience |
|
|
Reduced waiting timesfor fans to enter the stadium, using analysis of ticket data and fan movement to direct fans to the appropriate gates |
  |
Identification of more than 40% of resolved issuesbefore the game, minimizing negative impacts on the fan experience |
 |
10% increasein fan satisfaction in the first full season after Executive Huddle was deployed |


 |
Increased innovation of new solutions at the speed of business |
|
|
Greater agility, with simpler application and data architectures |
 |
Faster, simpler enhancement of business processes |
 |
Enhanced ability to provide the right data to the right person in real time |
|
IT resources that can now focus on new solutions, with a single database platform that combines database, advanced analytics, data integration, and application services |
| |
Enhanced abilityto manage customer and sales order data, thanks to a single, powerful, in-memory data platform that handles large data volumes in real time |
 |
Instant evaluationof each order and whether it can be delivered as promised, with real-time alerts to CSOs |
 |
Increased ability for CSOsto follow the order-to-cash flow and make more-informed, proactive decisions using a customer service cockpit |
|
|
More time for CSOsto focus on critical tasks and customer communication, enhancing customer service |


|
Real-time reports with the depth and breadth of information tailored for customers and management |
|
Better understanding of purchasing patterns, improving policies and procedures |
|
Enhanced insight into sales, demand planning, and supplier-network planning performance |
|
|
Higher productivity, efficiency, and performance of sales reps with full visibility of customer data in real time – even from mobile devices |

 |
Ability to generate reports instantlywith deep, broad information tailored for customers and management |

 |
Fine-tuned policies and proceduresresulting from a greater understanding of purchasing patterns |
|
Increased insightinto trends such as sales, demand planning, and supplier-network planning performance |
 |
Full visibility of customer datain real time – even from mobile devices – improving employee productivity, efficiency, and performance |


|
Enhanced ability to plan and predict with confidence |
|
Connection of real-time events with business processes, allowing users to take action in the moment |
 |
Faster identification of emerging threats and opportunities as they happen |
 |
Increased detection of anomalies, with ability to act in real time |
|
Integration of a large volume of historical data with fresh data for advanced analysis |

 |
Increased insightinto animal locations using sensor data analyzed by SAP HANA |
 |
Ability to track herds,identify when they are near danger, and move them to safer areas |
 |
130 elephantsrescued through collaring and relocation |
|
|
30 rhinosprotected from dehorning |
 |
100% reductionin poaching incidents in drone-protected areas |


|
Automated, improved business decisions made proactively, with confidence, and at scale |
 |
Enriched customer and employee experiences with automated, optimized business processes |
 |
Data-driven innovation, supported by machine learning embedded in applications and analytics, whether on premise or in the cloud |
|
|
Simplified IT landscape with one solution and less data duplication for data science needs |
|
|
Accelerated data science lifecycles for faster time to results |
 |
New insights discovered through applications and analytic solutions |
 |
Created a new type of insuranceto meet the needs of farmers and others affected by climate change and adverse weather conditions |
 |
Enabled cost-effective pricingand underwriting of index-based weather insurance targeted to clients’ unique weather risks, anywhere in the world |
 |
Reduced riskto leading weather-sensitive businesses, such as Axereal, one of France’s largest grain cooperatives |
 |
Realized 12x faster data uploadfor climate change–sensitive insurance |


 |
More data processed, in real time at a lower total cost of ownership |
|
Real-time decisions and the ability to take action in the moment |
 |
Increased cloud-vendor choice, with a multi-cloud and hybrid database platform |
|
Accelerated innovation through a simplified IT landscape |
| |
Reduced redundancy and simplified data management |
|
Single entry point for all data |
|
|
Migration to the cloudcompleted in less than 24 hours |

 |
3x to 240ximprovement in query performance |
 |
Instant provisioning of Amazon Web Services instanceswith scaling on demand |


|
|
Faster, more predictable system performance by spreading workloads across on-premise and cloud systems |
 |
Reduced TCO and increased flexibility by paying for peak performance only when needed |
 |
Enhanced innovation by exploring new possibilities in the cloud instead of expanding on-premise systems |
 |
Synchronized data balanced across deployments of SAP HANA in hybrid environments |
|
Increased system responsiveness, enhancing the user experience |
|
|
Ability to generate reports instantlywith real-time data access from analytics applications |
 |
Minimized data sprawlby connecting to data sources instead of collecting the data into soon-to-be-stale data marts |
|
|
Simplified landscapeby extending SAP HANA on-premise artifacts into SAP HANA Cloud |
|
Optimized manufacturing processes and supply chains using intelligent data |
 |
Ensured availability of supplies, exactly when customers need them |
 |
Reduced manual effort for ordering and tracking supplies |
 |
Improved process transparency and reduced operational costs through data orchestration |
| |
Increased sales revenue using a new, data-driven inventory management solution |
 |
Shortened prediction cyclefrom monthly to weekly, and replaced full-day manual work with just a few clicks |
|
Improved forecasting accuracy,optimized the forecasting cycle, and gained the ability to generate five weeks of predictions |
 |
Shifted toward a strategic approachbased on granular insight |
 |
Provided more employees and user groupswith access to information on market share |
 |
Leveraged an architecture blueprintthat can be applied to other analytics use cases |
|
Reduced production costs from defective goods and wasted materials |
|
Increased business continuity with fewer unexpected outages |
 |
Improved production forecast based on reliable operation of equipment |
|
Identification of weak spots in production lines, which allows optimization of equipment sourcing |
 |
Real-timeequipment health and performance monitoring as well as the ability to predict future behavior |
 |
Sensor-level time-series forecastingthat helps predict a sensor’s behavior over the next 24 hours |
|
Strong predictabilityfor abnormal events across groups of equipment |
 |
Holistic view of equipmentthat provides a better understanding of what triggers events as well as overall decomposition |
 |
Deep-dive equipment analysisthat reveals hidden patterns and provides insight about how various elements and events affect each other |
 |
System that learnsfrom its own data so that predictions become more accurate and effective over time |
 |
Holistic view of the supply chain and its dependencies |
 |
Ability to identify bottlenecks and prepare for alternatives |
 |
Proactive action taken for outages in single parts before they hit the overall process |
 |
Business continuity and reliable production by reducing risks to supply chains |
 |
Ability to visualize locations and service areas |
 |
Capacity to locate materials and capital projects |
|
Critical customer identification |
 |
Faster response, recovery planning, and execution processes |
 |
Ability to route, navigate, and track |
 |
Quickly process and analyzegeospatial data essential to the customer’s view of performance across miles of pipelines in real time |
 |
Streamlined operationsthat keep OGE fit to serve its consumers optimally |
 |
Cloud computingthat slashes the local system maintenance and software update load |
|
Clear GIS-enabled analytics,giving stakeholders immediate transparency into pipeline operations with little or no IT intervention |
 |
Field workersthat have solid guidance in locating pipelines and identifying maintenance and repair needs |
|
Increased confidence in decision-making at a higher speed |
 |
Simplified identification of business opportunities and new leads |
 |
Connected data that allows for in-depth analysis of business networks |
 |
Improved quality of master data on business partners |
 |
Increased sales revenueby discovering unused sales and up- and cross-selling potential in complex structures |
|
Reduced costsby eliminating expensive and time-consuming inquiries, leading to a savings of up to 50% of research costs |
 |
Gained abilityto avoid high-risk business contracts and penalties due to regulatory violations |
 |
Boosted strategic decision qualitywith high-quality, trustworthy data combined with graph intelligence and smart algorithms |
|
Improved data qualityby validating company structure and the ability to avoid duplicates and cleanse incorrect data |
 |
Derived new insightsand delivered deep analysis with unique and comprehensive algorithms within SAP HANA |
 |
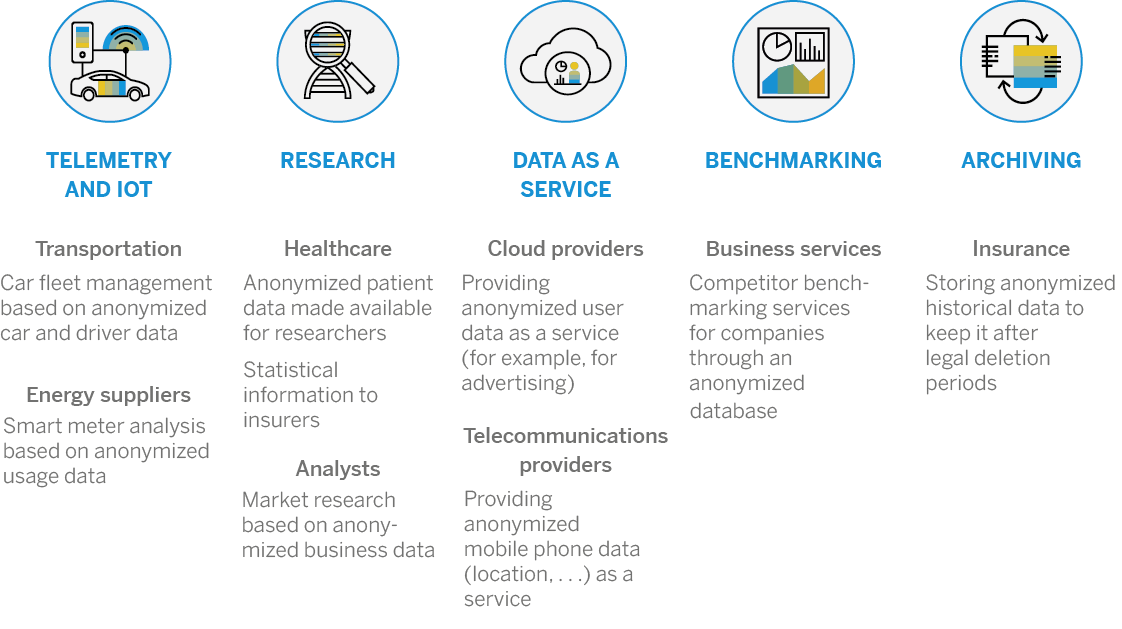
Maximized business value of sensitive or personal data while protecting the privacy of individuals |
 |
Enabled new data-centric use cases |
 |
Unlocked increased value of data by analyzing information that was previously available but not accessible |
 |
Enabled new business models for data syndication |
 |
Showed responsibility to customers and users by protecting sensitive and confidential data |
|
Enabled machine learning scenarios for analyzing sensitive data |
 |
Acted as a competitive differentiator for organizations |
 |
Targeted medication and treatmentsto each individual patient |
|
Developed a deeper understandingof the relationship between preconditions and reactions to treatment while adhering to data protection laws |
 |
Created a shareable “database”to fight COVID-19 |

 |
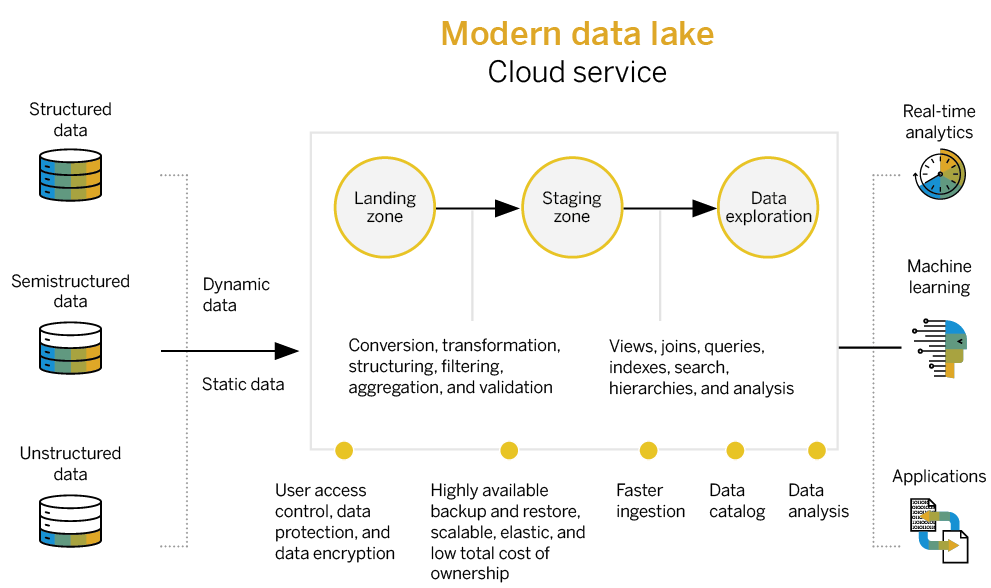
Cost control with lower-cost pricing on lower-volatility data |
 |
Access to cloud-data-lake data for smart multi-model processing such as machine learning, spatial, graph, and more |
 |
Enterprise security for data stored in the data lake |
 |
Centralized data access for governed single instances of valuable data |
 |
Processed position coordinatesfrom the NHL’s puck-tracking system every 30 milliseconds |
 |
Gave events and insightsreplicated to the Web site and benches every two seconds |
 |
Enabled instant analysisof archived data, considering 30 GB per game |
 |
Stored personal informationof 20 million fans protected by a variety of data privacy regulations (for example, GDPR, Personal Information Protection and Electronic Documents Act, and California Consumer Privacy Act) |

 |
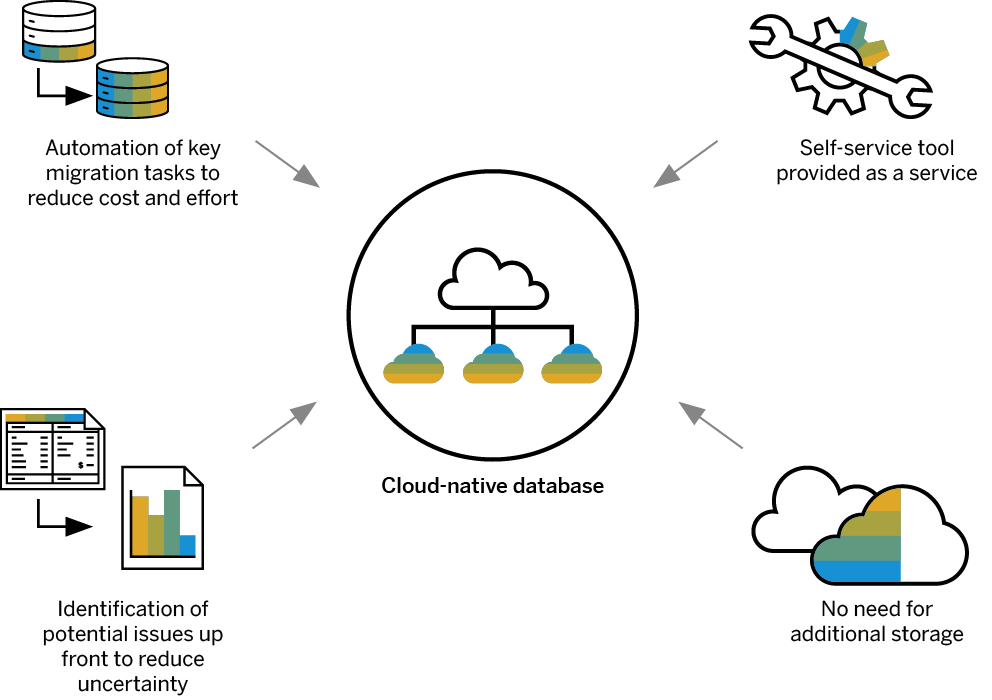
Connect your data sources, whether they’re on premise, in the cloud, SAP, or third party |
 |
Reduced TCO and increased agility through fully managed and scalable services |
 |
Flexible deployment options so you can extend on-premise investments or move completely to the cloud |
 |
Reduced complexity thanks to migration tools that remove the need for manual, time-consuming work |
|
Gained insightsinstantly by analyzing live transactional data |
|
Lowered TCOthanks to flexible data tiering options |
|
Higher availabilityby migrating to SAP HANA Cloud |
 |
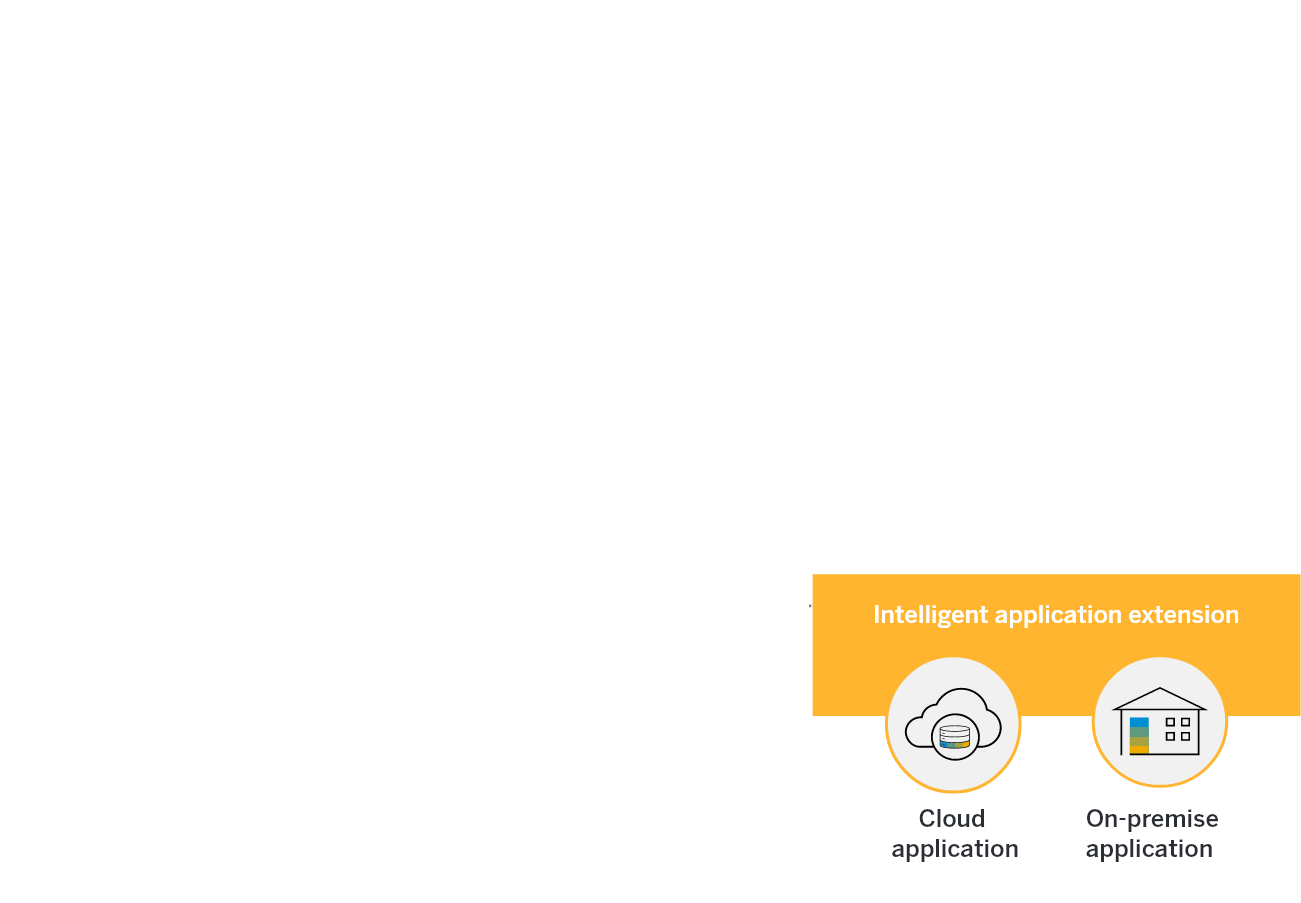
Anonymizes data in real time to protect business data without duplicating it |
 |
Incorporates SAP application security |


|
| Spatial and graph | |
Time series | |
Document store |
|
Text and search | |
Machine learning | |
Streaming |